


We did some benchmark testing on PyGaze. The results are explained on this page, and in our Behaviour Research Methods paper (downloadable here for those without access). The benchmark consisted of two experiments: one in which a gaze contingent dot was presented, and one in which it was not. For both experiments, samples were obtained in every iteration of a for loop that ran a 1001 times. This provided us with 1000 inter-sample intervals, for which we calculated means and standard deviations. On top of that, we’ve made some pretty graphs out of it. These are provided below.
The benchmark was conducted on three different systems:
| eye tracker | EyeLink 1000 | SMI RED-m | Tobii TX300 |
|---|---|---|---|
| computer | Dell Precision PWS 390 | Clevo W150 ER | custom build |
| processor | Intel Core 2 6600, 2.40 GHz | Intel Core i7-3610QM, 2.30 GHz | Intel Core 2 4300, 1.80 GHz |
| RAM | 3 GB | 16 GB | 2 GB |
| OS | Windows XP | Windows 7 | Windows XP |
| monitor | Phillips Brilliance 202P7 | LG-Philips LP156WF1 (built-in) | Tobii TX Display |
| resolution | 1024×768 | 1920×1080 | 1280×1024 |
| refresh rate | 60 Hz | 60 Hz | 60 Hz |
Results
No display test
This test was aimed at measuring the maximal frequency at which PyGaze could sample gaze position. The results are very clear on this: sampling is done very fast, at rates of 50 000 to over 300 000 Hz. This does not mean you get a new gaze position sample at this rate, though! PyGaze is limited to the sampling rate of the eye tracker in providing fresh samples; when no new fresh sample is available, you will simply get the newest sample.
Figure 1 shows that mean inter-sample times are very low: under 0.005 milliseconds for the RED-m and TX300, and between 0.015 and 0.02 milliseconds for the EyeLink 1000. Performance is equal for both display types.
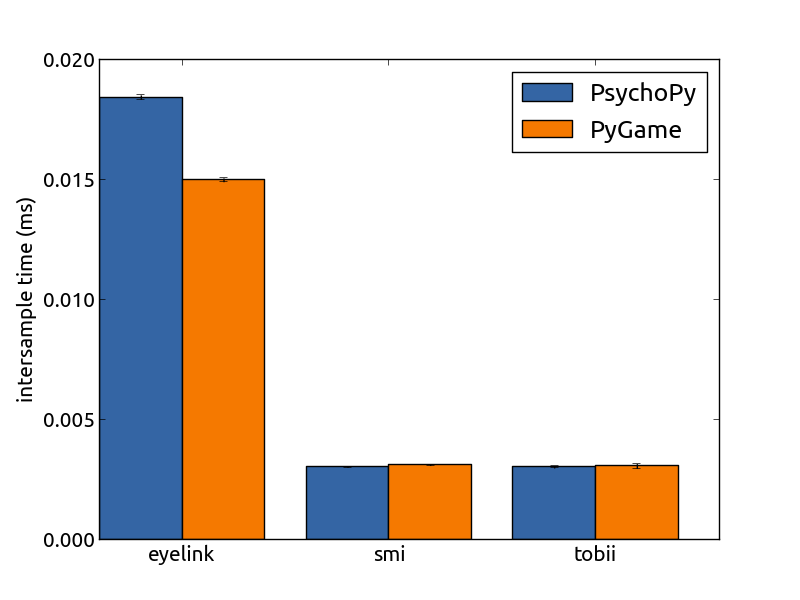
Figure 1 – mean inter-sample times in the no-display benchmark test
Figure 2 shows all 6000 inter-sample times that we measured in the no-display test. As you can see, there are only a few outliers, and even those are still under 0.1 millisecond. This means PyGaze’s sampling rate will not provide any notable delays in your software.
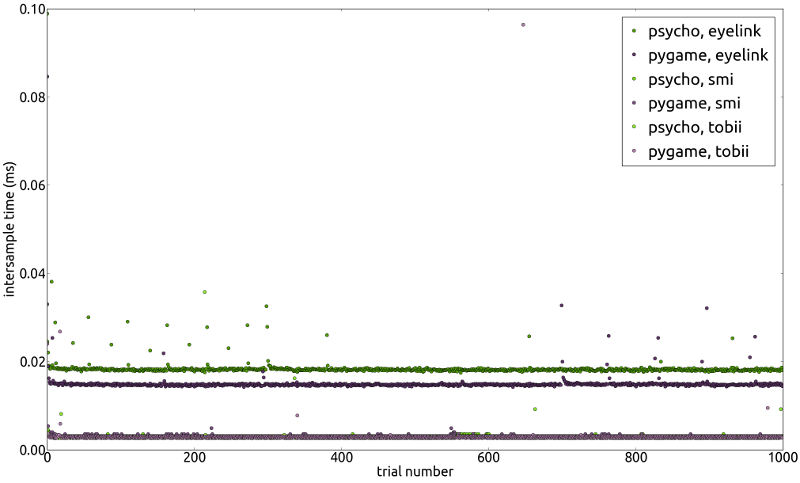
Figure 2 – all inter-sample times in the no-display benchmark test
Display test
This test was aimed at measuring how well PyGaze would perform in a standard gaze-contingent experiment, in which a sample is obtained and then used to create a stimulus. In our experiment, a dot was presented at the current gaze position.
Figure 3 shows that mean inter-sample times for PsychoPy are very consitent: they are around 16.7 ms (which is the duration of a single display refresh cycle on all of the setups used in this test), with very little deviation. Deviation is a bit higher on the TX300 setup, in which 3 frames were dropped (no frames were dropped in the other tests). This means that in three frames, drawing operations took too long and required two display refresh cycles to complete. In the other 2997 frames, drawing operations were finished within a single refresh cycle (which is what you want, since this provides the fastest gaze-contingent display possible).
Another observation is that drawing times for PyGame differ quite a bit from those for PsychoPy. This is because PsychoPy waits for the vertical refresh, i.e. it halts all operations until the monitor has started drawing a new frame from the top. It does so to make sure only one stimulus display is present at each refresh, meaning that no stimulus will be presented only half (if drawing it started half-way during a screen refresh, and the drawing of the next stimulus started at the drawing of the next refresh). Another difference is that for the PyGame display type, the central processing unit (CPU) is used, whereas in PsychoPy the graphic processing unit (GPU) is employed. You can see the effects in the results: our RED-m test device is a beast, so drawing times are quite low. Our TX300 computer, however, is ancient and produces very high drawing times.
The take home message is that PyGaze succeeds in working at the optimal display frequency for a gaze-contingent experiment in our setups, and is likely to do so in yours as long as you employ a somewhat decent computer.
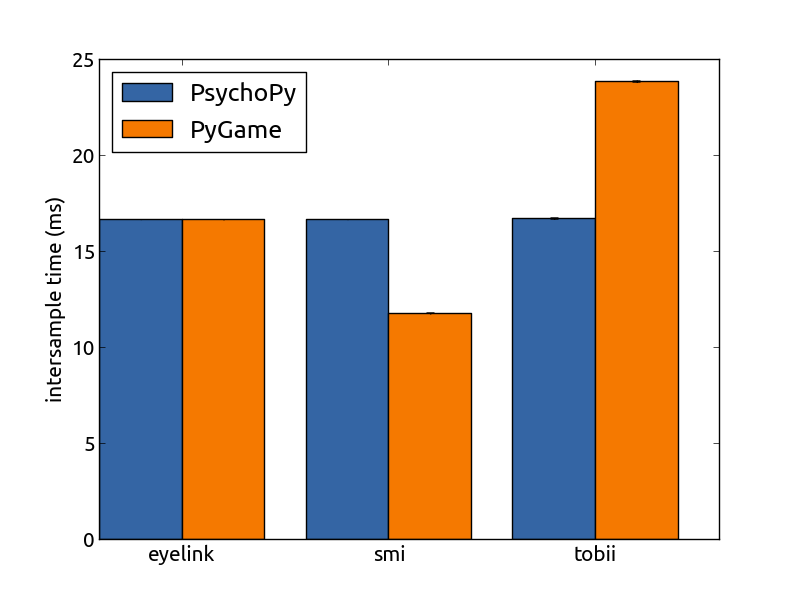
Figure 3 – mean inter-sample times in the gaze-contingent display benchmark test
Figure 4 shows all 6000 inter-sample times that we measured in the display test. As you can see, there are only a few outliers. These results indicate that PyGaze did a very good job displaying a fast gaze-contingent display on our setups, with frame drops only on the TX300 setup (which is likely due to the slow PC). Note that the PsychoPy display type provides the most accurate display types.
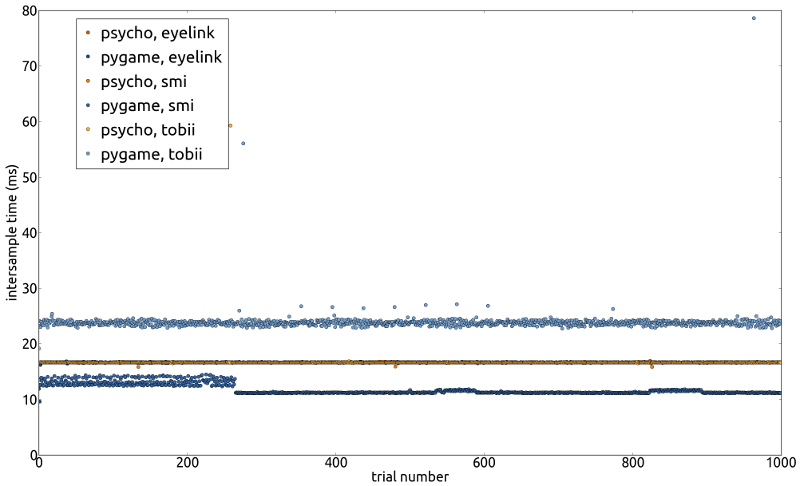
Figure 4 – all inter-sample times in the gaze-contingent display benchmark test
Downloads
Benchmark experiments
The experiments we have used in our benchmark test are available for download. Feel free to use them to test your own setup!
Raw data
The raw data we have obtained on all three of the setups mentioned on this page, is available for download. The data files are simple text files, containing a thousand inter-sample times each. Feel free to analyze them yourself, to see if we did it right.