


Not the eyes, but eye movements are the window to one’s soul: Your point of regard (where you are looking at) reveals where your attention goes out to, and scientist and marketing specialist can use this information for more than you might think at first. Your eye movements can tell us whether an advertisement works or not, if a website has a sensible lay-out, and what kind of elements in any visual scene attract attention. Apart from the treasure cove of information about human nature, eye tracking (the art of measuring eye movements) provides the coolest pictures you will ever see in science.
Eye tracking
Basic eye tracking is relatively simple: we put a volunteer behind a screen, point a camera at her face, and show her a few images while the eye tracker records her eye movements. If you want to know precisely how the camera knows where our volunteer is looking at, please see my previous post. If you want to know what we do with the data, please do read on!
The basic idea behind this kind of research, is that where you are looking at, is also where you are paying attention to. In general, this is a very sensible assumption: Our eyes have the highest acuity in the centre of our gaze, therefore we need to look at things to be able to see them properly. Of course, we all know that one can attend to something (or someone!) in the corner of our eyes. In cognitive psychology, we call this covert attention, and we will ignore this for now. Our volunteer has been placed in a dark room, all alone, and has no reason to covertly attend to anything. We will simply assume that whatever she is looking at, is also what she is interested in.
Types of eye movements
Before we start diving into the data, we need to know what we are looking for. In general, there are two things we generally do with our eyes. The first is looking at stuff for a prolonged period of time (i.e. several milliseconds); we call this a fixation. The second thing we do a lot is move our eyes from one point to the next; we call this a saccade. Saccades happen insanely quick, and we are practically blind whilst making them. Fun DIY experiment: grab a friend, and tell him to look at your left eye, then ask him to make a saccade to your right eye. Unsurprisingly, you see your friend’s eyes moving. Now ditch your friend, and find a mirror. Look at your own left eye, and then make a saccade to your right eye. You didn’t see your eyes move at all! This phenomenon is called saccadic suppression, and it is why we will be looking at fixations when we want to know what our volunteer has seen.
Apart from fixations and saccades, there are more measures that we can get from eye tracking. One of these if the pupil size, which provides information about where somebody’s attention is going out to even when they are not directly looking at it! The pupil is said to increase with arousal as well, meaning that your pupils will increase when you look at someone you like. Regrettably, measuring pupil size while someone is making eye movements is quite challenging, as the eye movements themselves have an influence on the measured pupil size as well. So for now, we will stick to fixations and saccades.
PyGaze Analyser
I’ve spent my afternoon programming today, and the result is a toolbox for straightforward analysis of eye movements. It produces the types of images that are often used in commercial eye tracking, which are used to assess advertisements and web sites. Lucky for you, the source code for my analyser is completely open-source and available online! Now the only thing you need to start your own business is an eye tracker. Those can be quite pricey, though (unless you build your own), so either save some money or start looking for investors.
Raw data
The first thing our eye tracker gives us, is a really big data file, containing lots of numbers. I’ve used an EyeLink 1000 for the examples in this post, which gives you a thousand samples per second. That means that if you record somebody looking at an image for twenty seconds, you will have 2000 timestamps, (x,y)-coordinates, and pupil size samples. If you realise that most eye-tracking experiments can take up to (and often over!) an hour, you will understand why the data files are so big!
I’ve visualised a bit of raw data for you in figure 1. Every grey dot is a sample: a (x,y)-coordinate of where our volunteer looked at that particular millisecond. Some grey dots are grouped close together, so they are likely part of a fixation. Some are spaced relatively far apart, so those are likely to be part of a saccade.
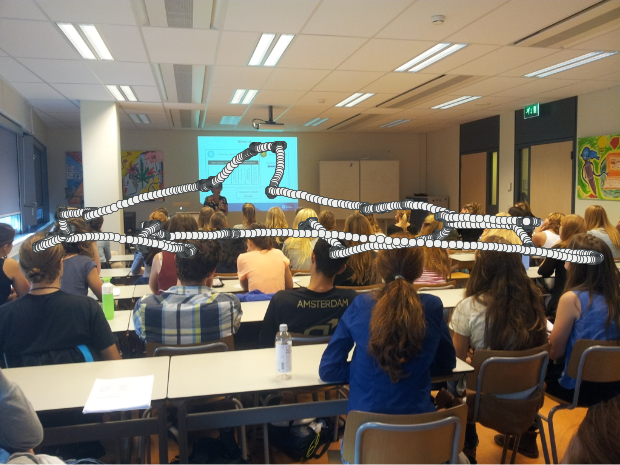
Figure 1 – The grey dots are raw data points, collected while a volunteer was looking at the image.
So how do we go from raw data points to fixations and saccades? Well, that is a very good question! Although there are several methods to do so, the most generally accepted approach is calculating the velocity and the acceleration of the eye movement. The velocity is calculated by dividing the distance between two samples by the time that has elapsed between recording those samples. The acceleration is the difference in velocity from sample to sample. It’s sufficient to understand that while either the velocity or the acceleration are above a certain value (a threshold), we speak of a saccade. A fixation is usually defined as a group of samples that is within close proximity of each other.
Anyhow, on with the exciting stuff! Know that we know how to analyse raw eye-tracking data, let’s start making those fancy pictures.
Fixation map
As I have mentioned before, the fixations are when the actual seeing happens. So the most straightforward thing to do, is to draw all the fixations we have recorded while our volunteer was looking at an image. An example of this is shown in figure 2. The green circles represent the fixations that our volunteer made while looking at the image of a sunset. The larger the circle, the longer the fixation lasted. From this fixation map, we can already conclude that our volunteer had a particular interest for the sun, and the girl that is standing on the beach.
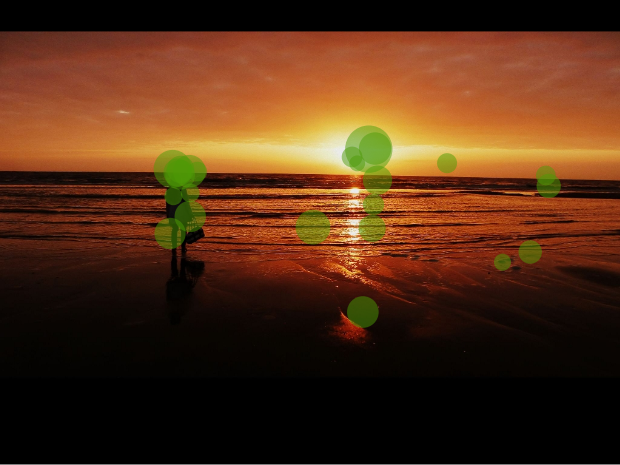
Figure 2 – The green circles represent fixations: the larger a circle is, the longer the fixation duration.
Scanpath
Although figure 3 may seem a bit confusing at first glance, if you look closely you will find that it provides more information than the fixation map we have seen in the previous paragraph. In a scanpath saccades are represented by arrows, and fixations are often numbered, so you can assess the order in which our volunteer has looked at things. As you can see, the first saccade immediately went for my face. This is something we commonly see in humans: they love looking at faces! It seems, though, that our volunteer got tired of my face rather quickly. He decided to look at the glass head on the desk, a book in a stand next to the monitor, the keyboard, the right monitor, and finally made a lot of fixations on the computer’s display. Curiously, the display showed my eye, so we could still count this as face-gazing behaviour.
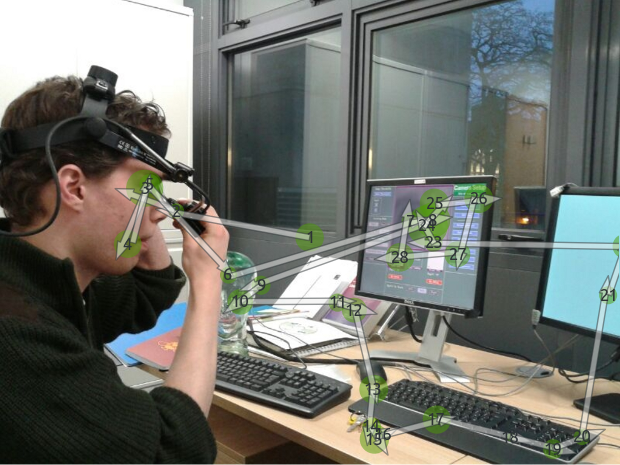
Figure 3 – The scanpath of a volunteer looking at an image of me fiddling with an EyeLink II.
Heatmap
All right, I promised you pretty pictures, so let’s get to the pretty pictures! A heatmap shows where the largest concentrations of a volunteers’ fixations were. In figure 4 we see a heatmap of gaze behaviour on a picture of a beautiful girl posing with a street performer. We can clearly see where the attention of our volunteer went out to: faces, and especially to the prettiest face in the picture! Also note the blob of blue on the girls chest, indicating that this draws attention too. There you have it: scientific proof that men like staring at women’s breasts.
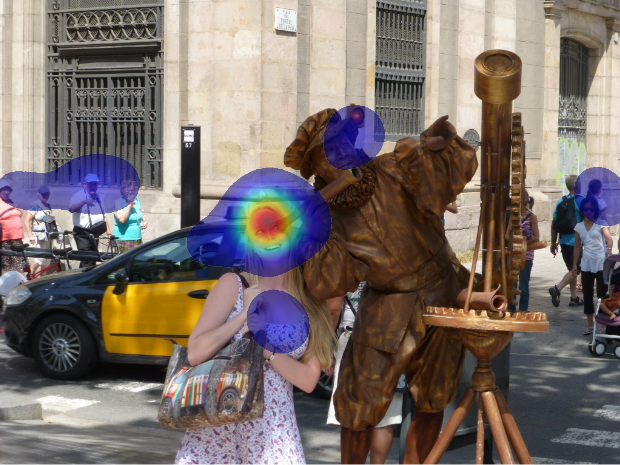
Figure 4 – A heatmap of a volunteer’s fixation behaviour on a holiday picture.
Another heatmap, figure 5, shows three scientists (yours truly on the right) at the European Conference on Eye Movements (Lund, 2013). The picture shows us discussing some software of mine, and the heatmap shows that our volunteer cares more about the faces than about scientific posters.
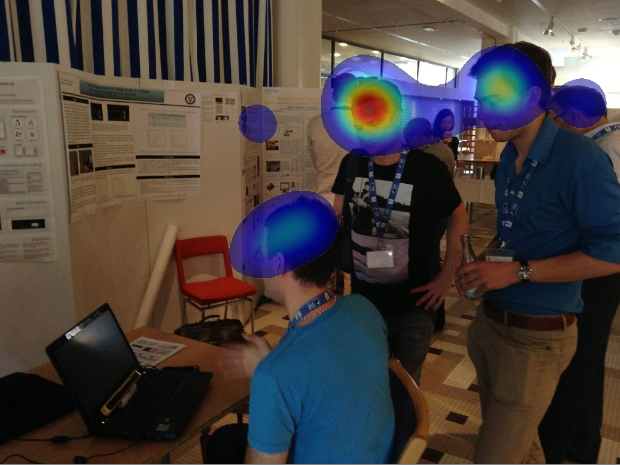
Figure 5 – A heatmap of a volunteer’s fixation behaviour on a picture of a few scientists.
Marketing research
Now that you have seen some heatmaps of pictures of everyday life, let’s move on to advertisements. An ad is aimed at drawing people’s attention, so testing what parts of an ad draw people’s attention provides the advertiser with interesting knowledge. Considering the fact that some advertisements cost a lot of money, being able to test if yours works on a few volunteers may actually save a company millions on a wasted ad campaign. Eye tracking is a great tool, as it measures where the attention of people is going out to, which is exactly what advertisers want to know!
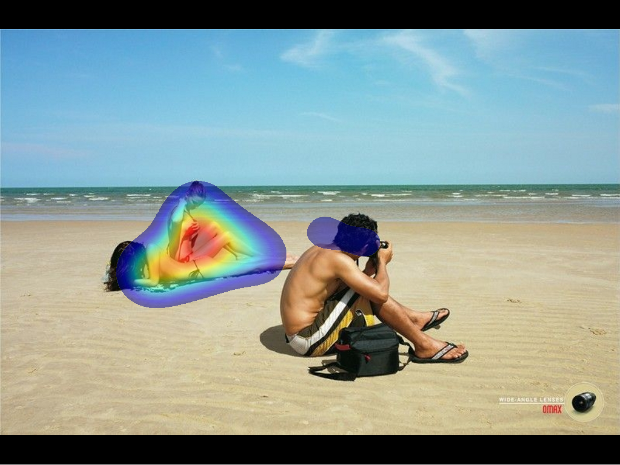
Figure 6 – Heatmap of an advertisement; the text on the bottom right reads “wide angle lenses”.
An example of a funny advertisement is show in figure 6. It shows two woman undoing their tops on a beach, and a man that seems to be ignoring them. Little do they know, that the man is spying on them using his new Omax wide angle lens! If you look at the heatmap of a volunteer’s gaze behaviour (who might or might not be me), you might wonder if the volunteer has any clue what the advertisement is about… Although the volunteer does seem to have a profound interest in the photography of near-naked woman, he completely missed the company’s logo on the bottom right. Some marketing guru’s might tell you that sex sells, and that commercials need to be funny, but eye tracking of this particular ad seems to prove otherwise!
Website usability
Another practical application of eye tracking, is in assessing websites. Below are two examples: figure 7 shows a documentation website for software, and figure 8 a bikini webshop.
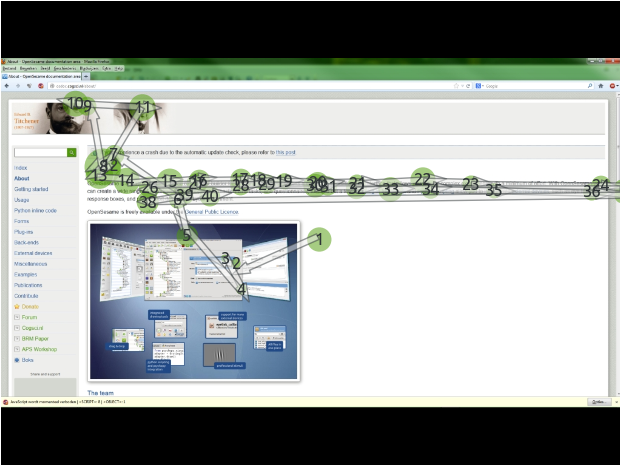
Figure 7 – Scanpath of OpenSesame’s documentation website.
Figure 7 shows that our volunteer first looked at the pictures on the documentation site of OpenSesame (an open-source graphical experiment builder that’s becoming popular in the social sciences), and then started to read the text. The text on the screenshot in figure 8 seems to be of less interest to our participant, who spends most time looking at lady parts and other pictures on the website.
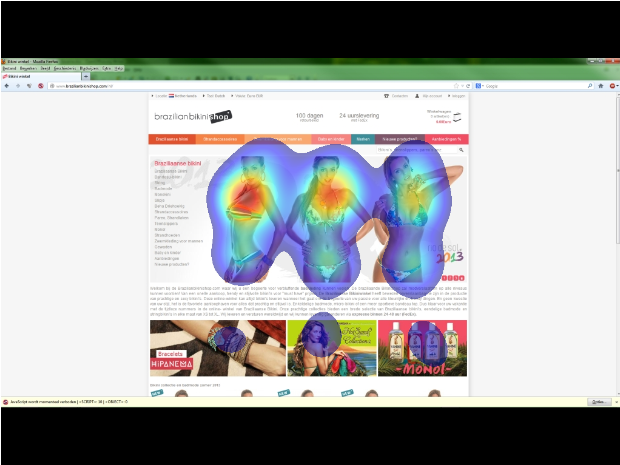
Figure 8 – Heatmap of a bikini webshop.
Although gaze data of a single volunteer on a single screenshot of a website is too little information to base strong conclusions on, we could cautiously state that both websites seem to be doing their job: The documentation website provides information that is in fact being read, and the products that the webshop sells manage to grasp the attention of our volunteer.
Low-level visual saliency
The final example is one of more scientific interest: figure 9 depicts my old office building at night (the light on the top-right is me, pretending to work). The heatmap shows that most fixations have been on the lighter parts of the image, which reflects a well established phenomenon: people tend to look at the most salient stimuli. A salient stimulus is a part of the image that stands out. In this case, the bright lights have a high contrast with the dark environment, making them attractive targets for eye movements.
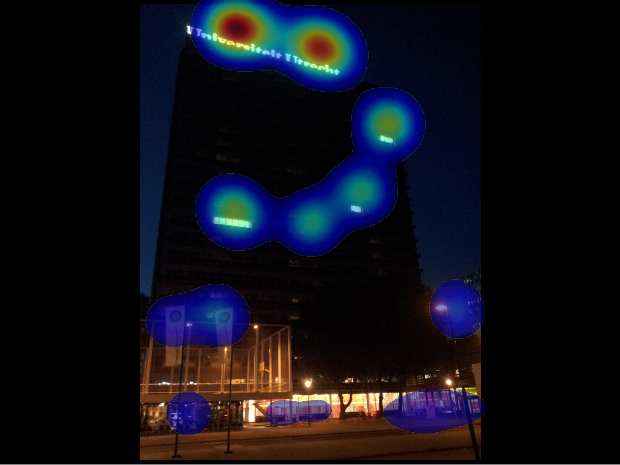
Figure 9 – Heatmap showing that attention goes out to high-contrast areas.
The keen observer will notice that most blobs are positioned slightly above the actual lights. This likely does not reflect a human tendency to look slightly above salient stimuli, but a drift in our measurements: the volunteer has probably moved a bit, which induces measurement error.
Conclusion
As you have seen by now, eye movements can be interesting for a number of reasons. Whether you want to determine what advertisement works best, investigate how low-level stimulus features (like brightness) influence attention, or if you want to scientifically establish that men like to look at lady parts: eye tracking is for you.
Using the PyGaze Toolbox, you can create eye-tracking experiments yourself. Using the new PyGaze Analyser, you can also analyse the eye movement data yourself. Best of all: both are completely free and open source! More options and features will continue to be added to all PyGaze software packages, so stay tuned!
Downloads
A basic PyGaze experiment to show images, and the analysis script to produce images like the ones on this page, are available from GitHub. PyGaze Analyser’s full source code is available via GitHub too.
Hello I come across your website which is very informative.
I am trying to experiment with my eye tracker, but I am abit confused as the world camera is attached to the eye tracker and I am trying to measure eye movement on screen but in this case the world camera is showing things outside the screen. How can I overcome this?
What kind of tracker do you have, and what is the ‘world camera’ you are talking about?
Assuming you’re using eye tracking glasses that have a camera pointed at the eyes, and one pointed at what the participant can see: I don’t think I understand the problem. Your participants could be looking outside of the screen, and your gaze recording should reflect this. (Again, not sure what you mean by ‘world camera’. Details are very useful for debugging issues.)
So, if I want to learn the code on GitHub. Do I need to do some experiments first and then get the eyedata? “Read Files”- which kind of files I need to provide before coding?
Thank you
Hi sir,
Good day to you.
I would like yo study on eye gaze of people in the recorded video.
Can you advice me on the implementation in Python?
Thank you.
Luthffi.
“Now the only thing you need to start your own business is an eye tracker.” How can i build my own eyetracker. I want to make a project on Gaze detection; Where you are looking?
Hi Abdullah! To be honest, that comment was a bit tongue-in-cheek: It’s actually quite hard to make an eye tracker that works well! If you’re looking for something that works in some cases, you could have a look at my webcam eye-tracker project on GitHub: https://github.com/esdalmaijer/webcam-eyetracker
Please do note that this is more of a toy example than a real tracker, and that for gaze tracking you would have to add your own calibration routine. (My project tracks pupil and optionally glint within the eye image stream; you would need to do an on-screen calibration to translate that information to gaze position.)
Hey Edwin,
I’m trying to use your code along with a TobiiPro X3-120 and PsychoPy. I ran the slideshow script (experiment.py) with LOGFILENAME=’1′ and got the following two files in my data folder:
– 1.txt
– 1_TOBII_output.tsv
When I ran the slideshow analysis script (analysis.py), I got the following error:
No eye data file (neither ASC, nor EDF) file found for participant ‘1’
Is there anything I need to change in my constants file or anything else I need to do before running the slideshow script?
Hi Alejandro,
It seems you’re using code that was intended for EyeLink (hence the reference to ASC and EDF), not Tobii. The underlying package, PyGaze Analyser, doesn’t currently support Tobii. Just EyeLink, EyeTribe, OpenGaze (GazePoint), and SMI.
Cheers,
Edwin
Hi, Sir
I have a question regarding eye tracking data from Tobii Eye tracker. I want to generate heatmaps, scanpath,and gaze plot. On different code snippets.
I have eye tracking data where I have fixation coordinates for left eye and and right eye , timestamp , and pupil dilation.
is this possible to analyse this data using Pygaze as I was looking in Pygaze analyser but do not know I can I imply fixation on code. I am really confused at this moment please let me know if there is some way to deal with it.
Regards
Vipul Semwal
Hey, Alejandro
I am also working on Eye tracking data and I am also struggling in analyzing it. I want to ask, how did you analyze the data after. When Pygaze-analyser can not help.
I want to create heat maps, scanpath, scaddes and etc.
Please let me know if you can help me in this.
I am also using psycopy for test and data collection.
Thank you in advance
Reagrds
Vipul Semwal
Dear Alejandro,
PyGaze does support Dikablis eye tracker?
Best regards
Konstantinos
Hello sir
I have a project I would like to use cheaper eye tracking device for autism detection can I used webcam or external CAMRA
please guide me with that
best regards
Hi Edwin,
I may have misunderstood, but is it necessary to be linked up to an Eyelink or eye-tracker while using this software? I have eye-tracking data files in the form of .txt files (although I can retrieve the original .edf files if necessary) and am trying to generate dynamic visualizations and overlay them over a video. Is this possible with PyGaze?
It is not! The analyser code works without any tracker or dongle attached, and the .ASC files generated through edf2asc (or its visual counterpart) are the files that should be read by the edf reader funtion.
Thanks! Also– when trying to install PsychoPy using the installation instructions in the package you compiled (since install_psychopy didn’t work), I followed the directions for Windows but when I run the psychopy_source_install batch file by double-clicking on it I’m getting “error: option –install not recognized”. Any suggestions?
Hi,
I was checking your package, particularly PyGaze Analyser. You did a really great job with such a clean package and lot to different visualization options.
However, I am wondering how can I use this with my Tobii pro glasses 2 data. I am not clear about following values:
DISPSIZE = (1024,768) # (px,px)
SCREENSIZE = (39.9,29.9) # (cm,cm)
SCREENDIST = 61.0 # cm
Where Tobii glasses has following parameters:
Scene camera format and resolution H.264 1920 x 1080 pixels @25 fps
Scene camera field of view 90°16:9
Scene camera recording angle/visual angle 82° horizontal, 52° vertical
If there is something you can help in.
Thanks in advance.
Gagan
Hi Gagan,
Those values would normally describe the monitor: DISPSIZE is the resolution, SCREENSIZE the physical size in centimeters, and SCREENDIST the distance between monitor and eye. In your case, only the DISPSIZE makes sense: this would be the resolution of the glasses’ front camera.
Good luck!
Edwin
Sir,
I am a beginner in eye tracking. I have a eye tribe of 30 Hz and get a raw data gaze x,y , time. I need to get fixation data x,y and time when fixation has happened. When I run the github code of event detection using Pygaze analyzer, fixation is null and some issues are present.
So my doubt is, Whether the code can be used to find fixation and saccade from gaze pos x and gaze pos y
whether tracking rate of eye tracker is an issue to find fixation and saccade. And how I can overcome from this error.
Please advise me in this.
@SK did you find a solution to get fixation points, along with time stamps from raw gaze data ?
Hello Edwin, I am a PhD student doing research on cognitive psychology. Is there a place where I can get a dataset of figures with scanpaths and fixations like the figure shown here (of you fiddling with the Eyelink?)
There exist such databases! For example, GazeCom has eye movements for videos: http://www.gazecom.eu/
Pingback: The $100 EyeTribe tracker – Quantitative Exploration of Development (Q.E.D.)
Pingback: PyGaze Analyser – Quantitative Exploration of Development (Q.E.D.)
Is it possible to use this with data from webgazer/gorilla?
Hi KE,
I’m afraid not, sorry!