


TL;DR
In cognitive neuroscience, we’re interested in what guides human attention. We distinguish between influences from high-level cognition (e.g. current goals), and low-level visual features. There are highly sophisticated models of how visual features such as intensity, colour, and movement guide human attention. Computerised implementations of these models allow computers to mimic human eye movements. Turns out Taylor Swift’s amazing videos are an excellent example!
Saliency
Human attention can be attracted to many different things. Our thoughts affect this process: If we see a picture of humans, we tend to be attracted to faces. But if someone asked us to judge their fashion sense, we might instead look at their clothes and ignore the faces. These cognitive factors are usually referred to as top-down effects, because they are thought to originate in the cortex, and flow downstream from there to bias the visual system.
Another very important factor that drives human attention and eye movements are low-level visual features. Specifically, humans (and other animals!) tend to be attracted to things that stand out: edges (lines in a drawing), areas of high contrast (stars in the night sky), odd colours (a black sheep in a see of white ones), and movement. These factors are usually referred to as bottom-up, because they originate from how our visual system works, and are relatively unaffected by our thought.
The term saliency has been used in different contexts, but tends to mean “interestingness”. For example, green squares on a black background have a high saliency, but the one red square among them has an even higher saliency. In addition, a square moving through an otherwise still scene is very salient.
Perhaps the most influential computational model of human attention through saliency is the model introduced by Itti, Niebur, and Koch in 1998 [1]. Their initial model focused on static images, in which three factors drive saliency: intensity, colour, and orientation. In later papers, they added two more factors to quantify saliency in dynamic videos: flicker and movement.
Channels and conspicuity
Intensity: In short, intensity is simply a black-and-white version of an image. To a computer, an image is a collection of values that represent the red, green, and blue contributions to each pixel. The average of these three colour channels is the unbiased intensity. (Note that actual black-and-white images are usually constructed in a biased way, because human eyes are not equally sensitive to green, red, and blue.)
Colour: Colour perception is very complex. It starts in the eye, where the retina contains four different types of colour-sensitive units. These include three cones, each sensitive for a different wavelength of light: short, middle, and long (sometimes referred to by the colour they are most sensitive to: blue, green, and red). These cones are what drives most of our colour perception. (The fourth unit is light-sensitive ganglion cells, who respond most strongly to wavelengths in the blue area. These are important for maintaining our day-night cycle.) Further in the brain, these colours are combined and contrasted in populations of brain cells that could be sensitive to a wide variety of things (colour, intensity, a combination, etc). Much is unclear, but we tend to think of the result as a space in three axis: Luminance, red-green, and blue-yellow. Therefore, Itti and colleagues’ models include both red-green and blue-yellow contrasts.
Orientation: Humans LOVE edges. Seriously. Neurons from retina to visual cortex are wired in such a way that they can recognise transitions in luminance to find the edges in any visual scene. This makes sense, as it is crucial to delineating objects from their environment. (It would be hard to pick up your hammer if you couldn’t see that it’s different from the table!)
Flicker: This concerns rapid in-place transitions in luminance. For example, a strobe light flickers, and would thus be picked up in this channel.
Movement: The visual system of very many organisms is sensitive to movement. Neurons are wired together in complex ways to be activated when edges move across their receptive field (the small part of your vision that they are interested in). These receptive fields can be small to pick up subtle movements, or very big to pick up movements that sweep across the visual field.
Conspicuity maps. The model of Itti, Koch, and Niebur deals with these five channels in ways that are loosely based on the human visual system. Specifically, they compute each channel from an increasingly small (lower-resolution) representation of the input image. In the visual system, there are neurons with small receptive fields, and so their combined information can be considered a high resolution ‘image’. There are also neurons with big receptive fields, and their information combines into a low resolution ‘image’. In the brain, neuronal populations with differently sized receptive fields are wired together to combine information across the spectrum. In the saliency model, a similar thing happens by subtracting lower-resolution representations with higher-resolution ones. These are then combined within a channel to produce a conspicuity map. One of these exists for each channel. (You can see them in the bottom of the video.)
A lot more happens in the model, including several steps of normalisation, and competition between the most conspicuous/salient parts of each image. For more info, please do read the paper by Itti and colleagues. You can find the full reference on the bottom of this page.
Static examples
Below you can see what happens if the saliency model is applied to an image with bars. In this image, one bar stands out because of its red colour, and one because of its orientation. The model does indeed pick this up, and in the different conspicuity maps you can see how the orientation channel picks up the green bar with the odd orientation, and that the colour channel picks up the red bar.
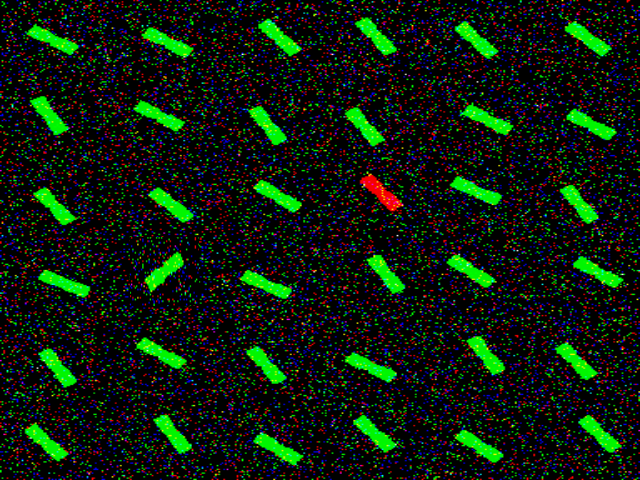
Array with orientation and colour popout stimuli
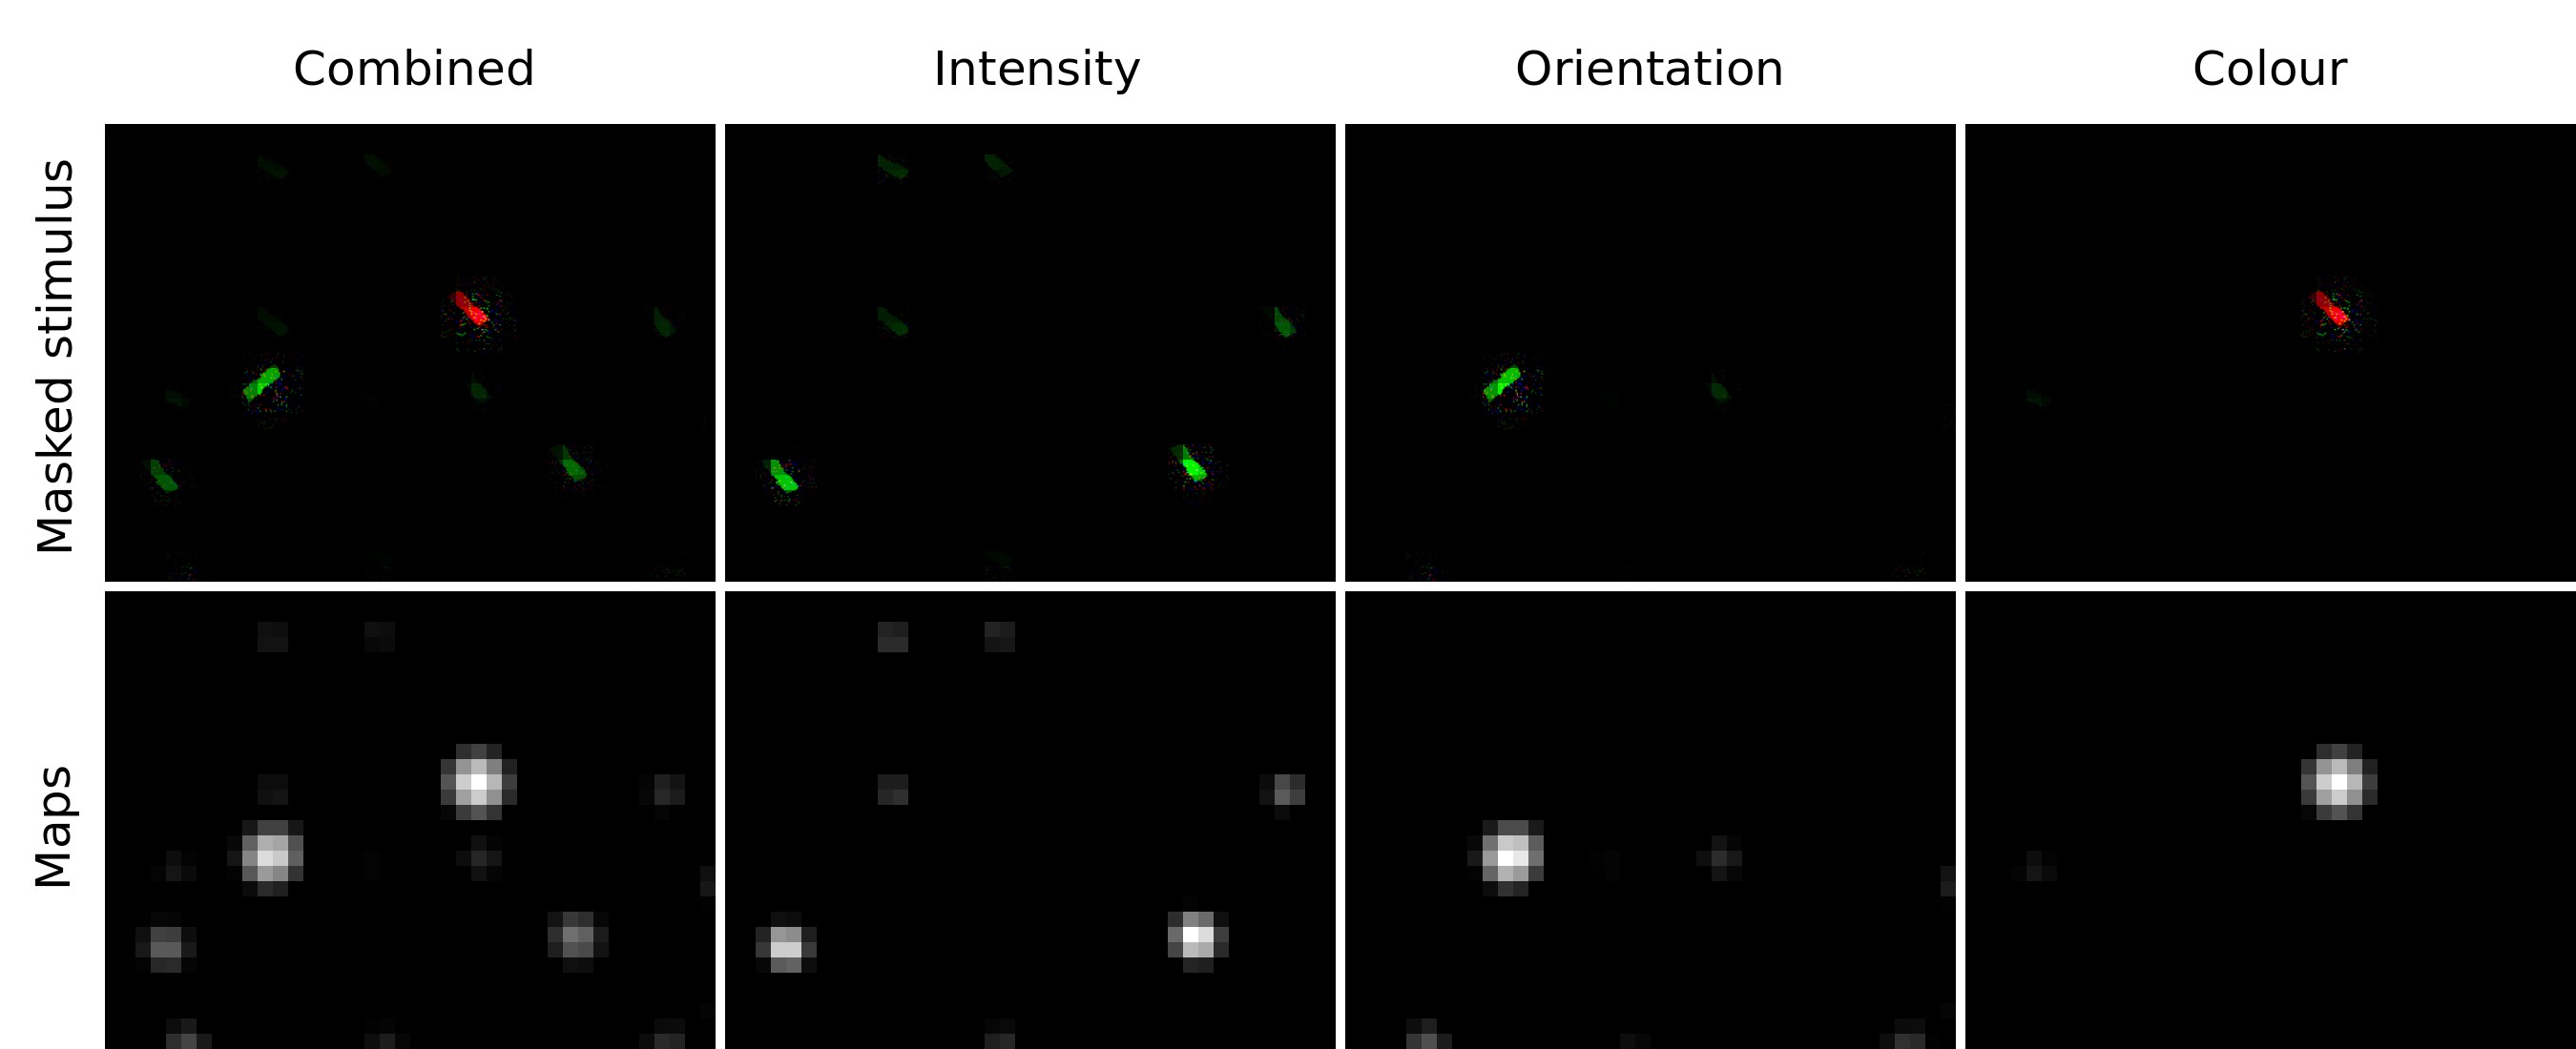
Saliency/conspicuity maps of the stimulus array, pure (bottom row) and as weighted stimuli (top row).
Dynamic examples
To illustrate how the saliency model deals with videos, I applied it to some Taylor Swift music videos. I found the videos on YouTube, where they were generously shared by Taylor Swift and her colleagues. All rights to the original videos of course remain with them, and I do not own any of the rights to them. I just hope my saliency-mapped versions will stay up!
Reference
- Itti, L., Koch, C. & Niebur, E. (1998). A model of saliency-based visual attention for rapid scene analysis. IEEE Transactions on pattern analysis and machine intelligence. 20 (11), p. 1254-1259.
Hi, Can I get the code for plotting saliency map for my videos
Your youtube video has been claimed by UMG. I’ve seen it before and it was a really interesting video, maybe you can reupload on Vimeo?